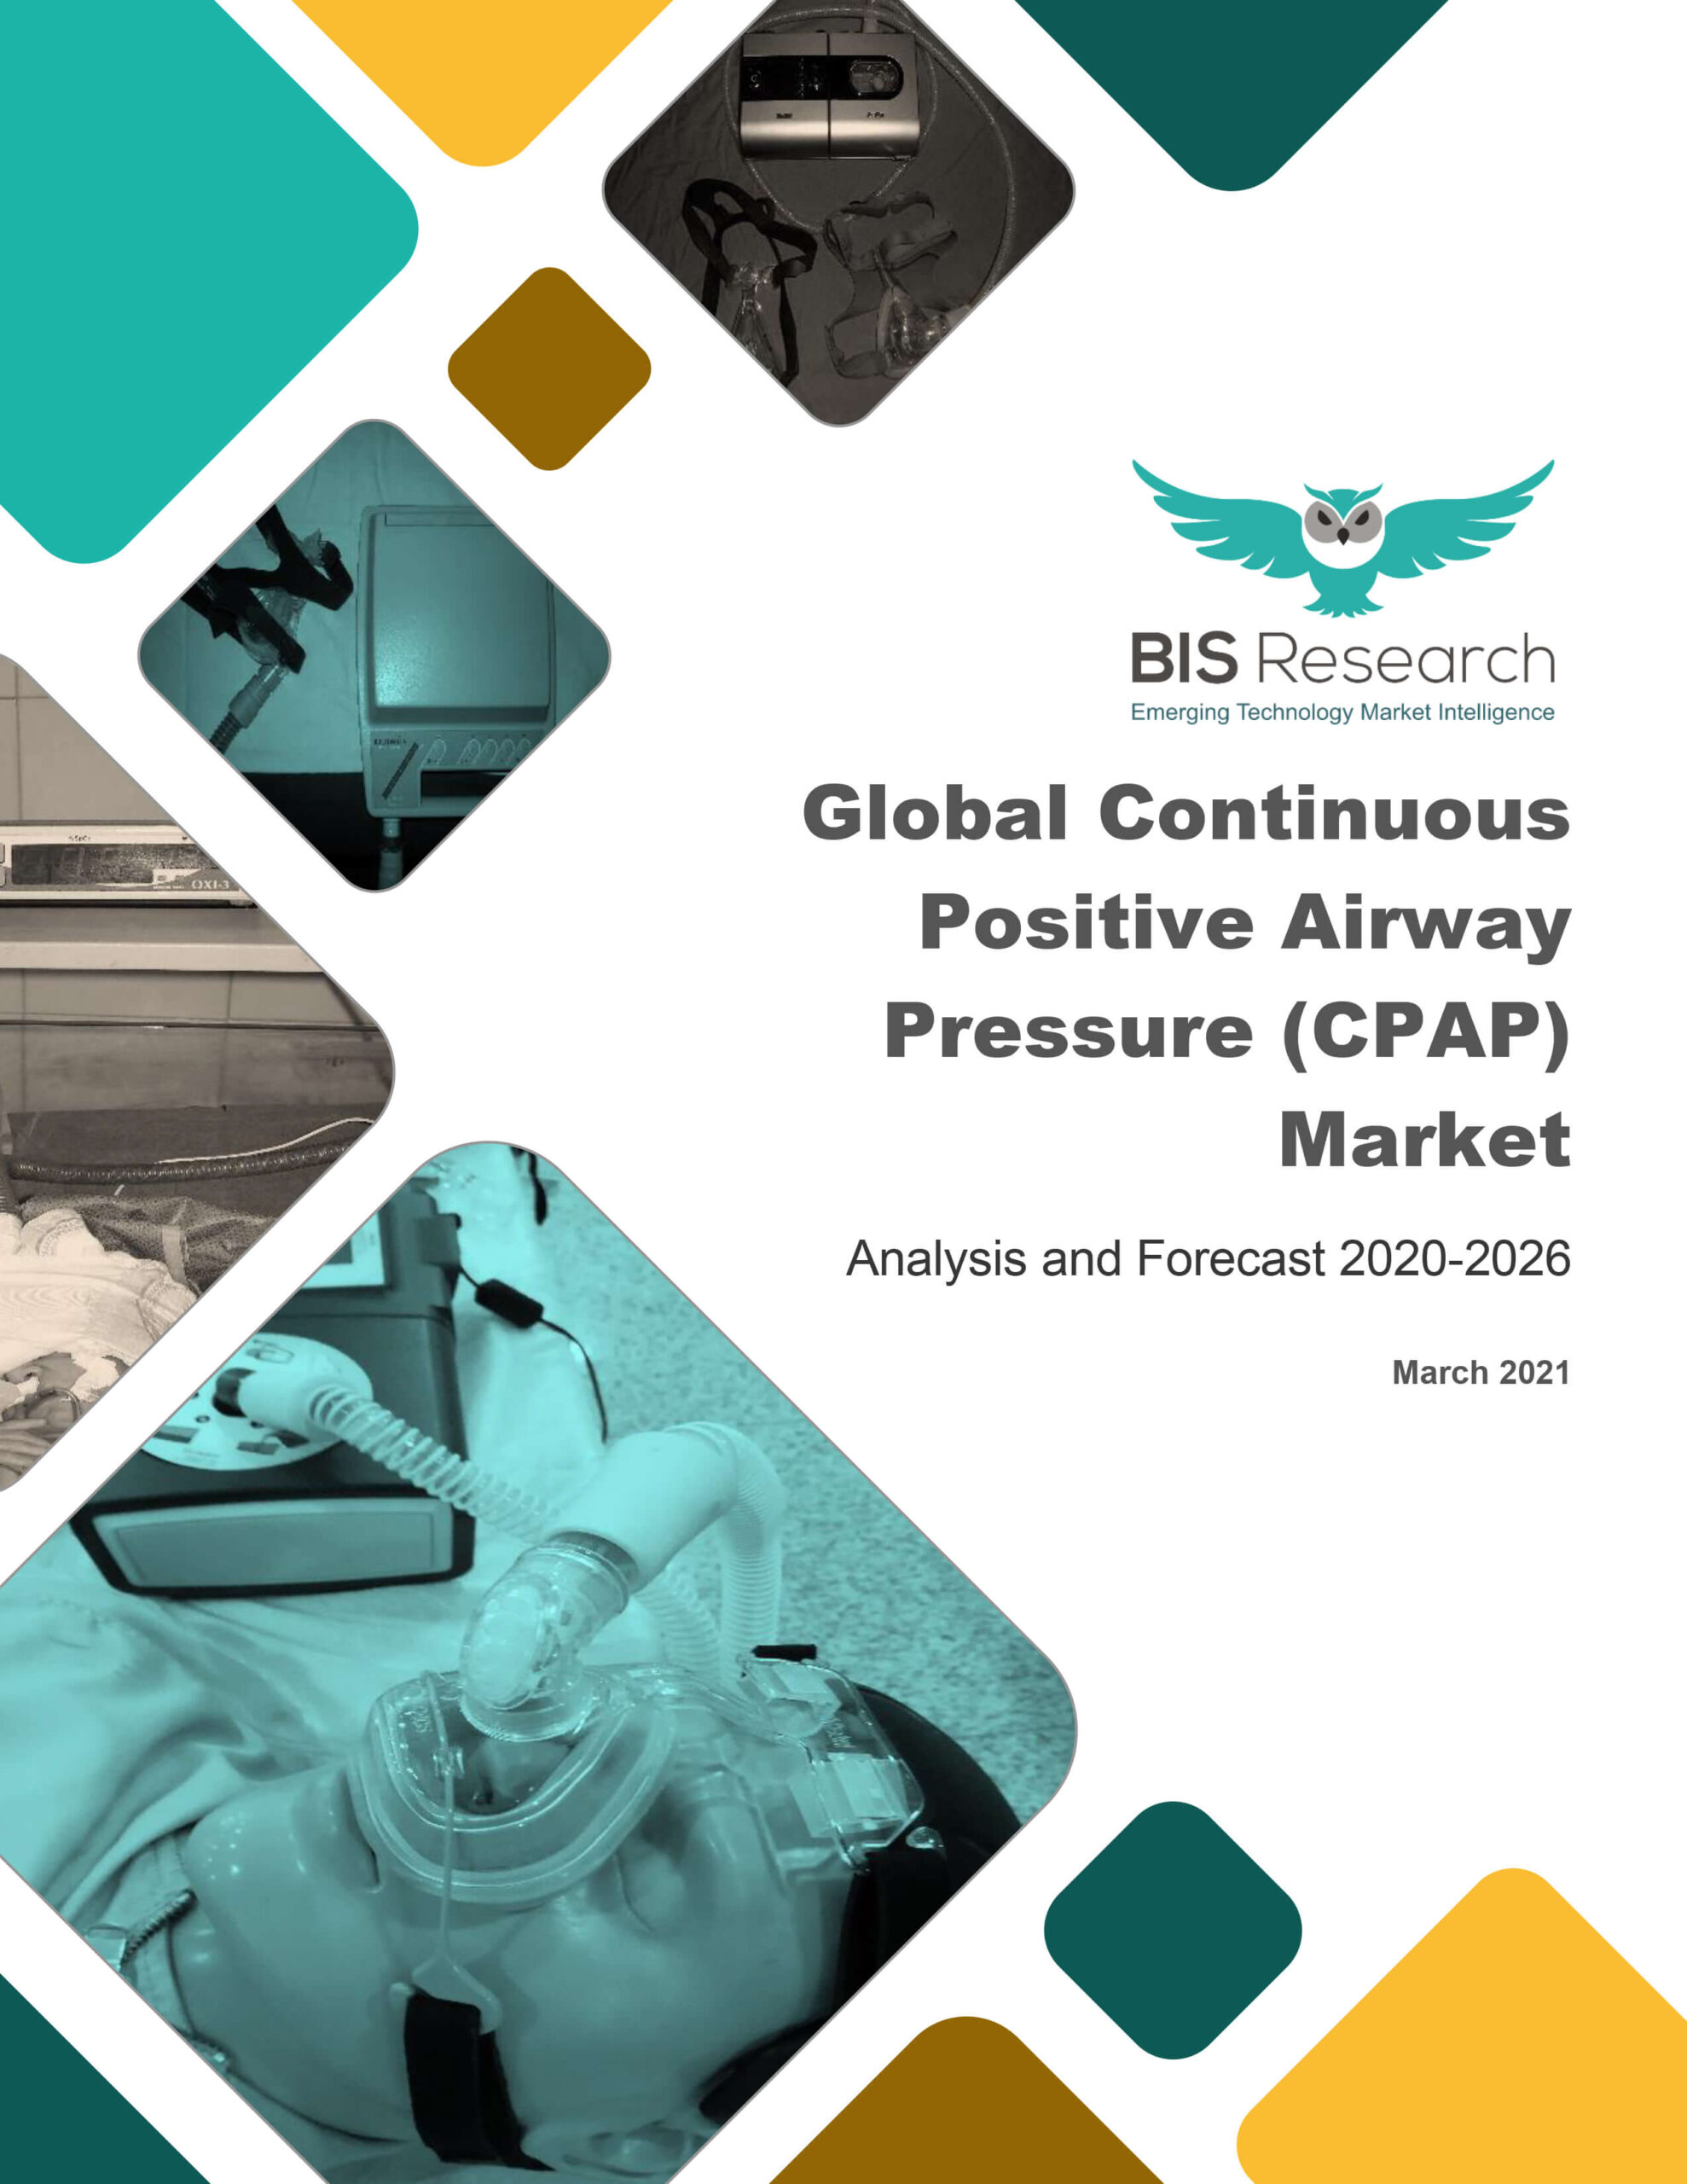
Global Continuous Positive Airway Pressure (CPAP) Market: Analysis and Forecast, 2020-2026

$5000$8000

Global Continuous Positive Airway Pressure Market to Reach $10,182.0 Million by 2026

Description

Market Report Coverage – Continuous Positive Airway Pressure (CPAP)

Market Segmentation

• End User (Hospitals and Clinics, Nursing Homes, Elderly Care Centers, and Home-Use)

Regional Segmentation

• North America – U.S., Canada
• EU5 – Germany, France, Italy, U.K., Spain
• Asia-Pacific – China, Japan, India, South Korea, Rest-of-Asia-Pacific (RoAPAC)
• Rest-of-the-World

Growth Drivers

• Rising Number of Startups Driving Innovation
• Increasing Prevalence of Obstructive Sleep Apnea
• Growing Prevalence of Respiratory Diseases Among the Geriatric Population
• Growing Prevalence of Chronic Respiratory Diseases across the Globe

Market Challenges

• High Upfront Cost of Device
• Side-Effects Associated with Long-Term Usage

Market Opportunities

• Development of Smart CPAP Devices
• Digitization of Device Training Modules to Promote Adoption

Key Companies Profiled

Airon Corporation, APEX MEDICAL CORP., Asahi Kasei Corporation, BMC Medical Co., Ltd, Drägerwerk AG & Co. KGaA, Fisher & Paykel Healthcare Limited, General Electric Company, Getinge AB, Koninklijke Philips N.V., Löwenstein Medical GmbH & Co. KG, Medical Depot, Inc. dba drives DeVilbiss Healthcare LLC, Medtronic Plc, ResMed, Inc., Smiths Group plc (Smiths Medical) and VYAIRE MEDICAL, INC.

Key Questions Answered in this Report:

• How has COVID-19 impacted the adoption of CPAP devices in the market?
• What are the key regulations which influence the adoption of CPAP devices in the market?
• What are some of the key brands in the global and regional CPAP market?
• Who are the top competitors in each region?
• What are some of the key factors influencing the growth in adopting CPAP devices across the globe?
• How do the brands compare against each other in terms of unit shipments?
• What are the fastest-growing countries in terms of CPAP adoption?
• Which are the key diseases driving the adoption of CPAP devices across the world?
• What are the key strategies being adopted by market players in the global CPAP market?
• Who are the most common end-users of CPAP devices, and how are the end-use segment expected to grow in the future?

Key USPs of the Report

Following are some of the key contents of the report:

• Epidemiological Landscape
This section includes exhaustive information on the epidemiology of key disease indications for the CPAP domain.

• Patent Scenario
This section encompasses a description of the current patent landscape in the continuous positive airway pressure field.

• Regulatory Framework
This section comprises the information on the regulatory framework for various regulatory bodies associated with granting approval to CPAP devices.

• Impact of COVID-19
This section of the report encompasses the following:
o Impact on CPAP Demand and Supply
o Regional Impact
o Future Impact (Short-, mid-, and long-term)

In addition, the report provides:

• A detailed analysis and growth forecast (2020-2026) for different end-users
• Recent developments and trends in the global market landscape
• Factors promoting and inhibiting the market growth

Expert Quote

“At present, what we have is heavy demand for CPAP devices due to the emergency regulatory authorizations made by FDA to use CPAP devices during the treatment of COVID-19. Will this demand remain high in the future when the healthcare industry is normalizing? It remains to be seen. The general idea is that it will gradually reduce back to normal, the rate of which depends on the type of recovery pattern from COVID-19”.

Scope of the Global CPAP Market

The purpose of the study is to enable the reader to gain a holistic view of the global CPAP market by each of the aforementioned segments.

The report constitutes an in-depth analysis of the global CPAP market, including a thorough analysis of the different end-users. The study also provides exhaustive information on disease epidemiology, competitive landscape, brand share landscape, market share of the leading players, number of CPAP units shipped, as well as other vital information with respect to the global CPAP market. The report considers CPAP device and Ventilators (offering CPAP mode) manufacturers.

Additional information

Publisher

Geography Covered

Date Published

Pages

Format

Base Year

2020

Base Market Size

$6, 411.7 Million in 2020

Currency/Unit

USD

Forecast Year

2026

Market Size Forecast

$10, 182.0 Million by 2026

CAGR

8.01%

Table of Contents

Executive Summary 1 Product Definition 2 Scope of Report 2.1 Scope of Study 2.2 Inclusion and Exclusion Criteria of the Report 2.2.1 Inclusion Criteria 2.2.2 Exclusion Criteria 2.3 Key Questions Answered by the Research Study 3 Research Methodology 3.1 Primary Data Sources 3.2 Secondary Data Sources 3.3 Data Source Categorization 3.4 Market Estimation Model 3.5 Data Validation 3.6 Selection Criteria for Company Profiles 3.7 Forecast, Assumptions, and Limitations 4 Impact of COVID-19 on Global Continuous Positive Airway Pressure (CPAP) Market 4.1 Industry Scenario: Impact of COVID-19 on the Global CPAP Demand and Supply 4.2 Regional Impact 4.3 Future Perspective 5 Epidemiological Landscape 5.1 Obstructive Sleep Apnea (OSA) 5.1.1 Global Prevalence and Incidence 5.1.1.1 North America Prevalence and Incidence 5.1.1.2 EU5 Prevalence and Incidence 5.1.1.3 Asia-Pacific Prevalence and Incidence 5.1.2 CPAP Devices Demand 5.2 Chronic Obstructive Respiratory Diseases (CORD) 5.2.1 Global Prevalence and Incidence 5.2.1.1 North America Prevalence and Incidence 5.2.1.2 EU5 Prevalence and Incidence 5.2.1.3 Asia-Pacific Prevalence and Incidence 5.2.2 CPAP Devices Demand 5.3 Neuromuscular Disorders 5.3.1 Global Prevalence and Incidence 5.3.1.1 North America Prevalence and Incidence 5.3.1.2 EU5 Prevalence and Incidence 5.3.1.3 Asia-Pacific Prevalence and Incidence 5.3.2 CPAP Devices Demand 5.4 COVID-19 5.4.1 Global Prevalence and Incidence 5.4.1.1 North America Prevalence and Incidence 5.4.1.2 EU5 Prevalence and Incidence 5.4.1.3 Asia-Pacific Prevalence and Incidence 5.4.2 CPAP Devices Demand 5.5 Other Conditions 5.5.1 Asthma Incidence 5.5.2 Asthma Prevalence 5.5.3 Pneumoconiosis Incidence 5.5.4 Pneumoconiosis Prevalence 5.5.5 Upper Respiratory Tract Infections Incidence 5.5.6 Upper Respiratory Tract Infections Prevalence 5.5.7 Lower Respiratory Tract Infections Incidence 5.5.8 Lower Respiratory Tract Infections Prevalence 5.5.9 CPAP Devices Demand 6 Industry Analysis 6.1 Industry Structure 6.1.1 CPAP Systems Manufacturers 6.1.2 Product Distributors / Resellers 6.2 Industry Supply Chain Analysis 6.3 Associations and Consortiums 6.4 Regulatory Framework 6.4.1 Regulations in North America 6.4.1.1 Food and Drug Administration (FDA) 6.4.1.2 Health Canada 6.4.2 Regulations in Europe 6.4.3 Regulations in Asia-Pacific 6.4.3.1 National Medical Products Administration (NMPA) 6.4.3.2 Pharmaceutical and Medical Device Agency (PMDA) 6.5 Patent Landscape 6.5.1 Patent Analysis by Country 6.5.2 Patent Analysis by Quarters 7 Competitive Landscape 7.1 Competitive Landscape 7.1.1 Market Share Analysis 7.1.2 Growth Share Matrix (2015-2019) 7.2 Key Developments and Strategies 7.2.1 New Offerings 7.2.2 Partnerships and Alliances 7.2.3 Regulatory and Legal Activities 7.2.4 Mergers and Acquisitions 8 Continuous Positive Airway Pressure Market Sizing and Forecast 8.1 Assumptions and Limitations 8.2 Opportunity Assessment 8.2.1 Opportunity Assessment 8.3 Global CPAP Market Size and Growth Potential, 2015-2026 8.4 Current Market Trends Analysis 8.5 Market Dynamics 8.5.1 Market Drivers 8.5.1.1 Rising Number of Startups Driving Innovation 8.5.1.2 Increasing Prevalence of Obstructive Sleep Apnea 8.5.1.3 Growing Prevalence of Respiratory Diseases among the Geriatric Population 8.5.1.4 Growing Prevalence of Chronic Respiratory Diseases across the Globe 8.5.2 Market Restraints 8.5.2.1 High Upfront Cost of Device 8.5.2.2 Side-Effects Associated with Long-Term Usage 8.5.3 Impact Analysis 8.5.4 Market Opportunities 8.5.4.1 Development of Smart CPAP Devices 8.5.4.2 Digitization of Device Training Modules to Promote Adoption 9 Continuous Positive Airway Pressure Market (by End-User) 9.1 Overview 9.2 Hospitals and Clinics 9.3 Nursing Homes 9.4 Elderly Care Centers 9.5 Home-Use 10 Continuous Positive Airway Pressure (CPAP) Market (by Region) 10.1 North America Continuous Positive Airway Pressure (CPAP) Market 10.1.1 Market Size and Forecast 10.1.2 CPAP Shipment (Unit Sold) 10.1.3 Pricing Analysis 10.1.4 North America Prevalence Analysis 10.1.5 North America CPAP Market Competitive Analysis 10.1.5.1 Market Share 10.1.5.2 Key Competitors 10.1.5.3 Unit Shipment and Brand Matrix 10.1.6 North America CPAP Market, by Country 10.1.6.1 U.S. 10.1.6.1.1 U.S. Prevalence Analysis 10.1.6.2 Canada 10.1.6.2.1 Canada Prevalence Analysis 10.2 EU5 Continuous Positive Airway Pressure (CPAP) Market 10.2.1 Market Size and Forecast 10.2.2 CPAP Shipment (Unit Sold) 10.2.3 Pricing Analysis 10.2.4 EU5 Prevalence Analysis 10.2.5 EU5 CPAP Market Competitive Analysis 10.2.5.1 Market Share 10.2.5.2 Key Competitors 10.2.5.3 Unit Shipment and Brand Matrix 10.2.6 EU5 CPAP Market (by Country) 10.2.6.1 Germany 10.2.6.1.1 Germany Prevalence Analysis 10.2.6.2 U.K. 10.2.6.2.1 U.K. Prevalence Analysis 10.2.6.3 France 10.2.6.3.1 France Prevalence Analysis 10.2.6.4 Italy 10.2.6.4.1 Italy Prevalence Analysis 10.2.6.5 Spain 10.2.6.5.1 Spain Prevalence Analysis 10.3 Asia-Pacific Continuous Positive Airway Pressure (CPAP) Market 10.3.1 Market Size and Forecast 10.3.2 CPAP Shipment (Unit Sold) 10.3.3 Pricing Analysis 10.3.4 Asia-Pacific Prevalence Analysis 10.3.5 Asia-Pacific CPAP Market Competitive Analysis 10.3.5.1 Market Share 10.3.5.2 Key Competitors 10.3.5.3 Unit Shipment and Brand Matrix 10.3.6 Asia-Pacific CPAP Market, by Country 10.3.6.1 China 10.3.6.1.1 China Prevalence Analysis 10.3.6.2 India 10.3.6.2.1 India Prevalence Analysis 10.3.6.3 Japan 10.3.6.3.1 Japan Prevalence Analysis 10.3.6.4 South Korea 10.3.6.4.1 South Korea Prevalence Analysis 10.3.6.5 Rest-of-Asia-Pacific 10.3.6.5.1 Rest-of-Asia-Pacific Prevalence Analysis 10.3.6.5.1.1 Bangladesh 10.3.6.5.1.2 Pakistan 10.3.6.5.1.3 Malaysia 10.3.6.5.1.4 Indonesia 10.4 Rest-of-the-World Continuous Positive Airway Pressure (CPAP) Market 10.4.1 Market Size and Forecast 10.4.2 CPAP Shipment (Unit Sold) 10.4.3 Rest-of-the-World CPAP Market (by Region) 10.4.3.1 Europe Excluding EU5 10.4.3.2 MEA 10.4.3.3 Latin America 11 Company Profiles 11.1 APEX MEDICAL CORP. 11.1.1 Company Overview 11.1.2 Role of APEX MEDICAL CORP. in Global Continuous Positive Airway Pressure Market 11.1.3 Recent Developments 11.1.4 SWOT Analysis 11.2 Airon Corporation 11.2.1 Company Overview 11.2.2 Role of Airon Corporation in Global Continuous Positive Airway Pressure Market 11.2.3 Recent Developments 11.2.4 SWOT Analysis 11.3 Asahi Kasei Corporation 11.3.1 Company Overview 11.3.2 Role of Asahi Kasei Corporation in Global Continuous Positive Airway Pressure Market 11.3.3 Financials 11.3.4 SWOT Analysis 11.4 BMC Medical Co., Ltd 11.4.1 Company Overview 11.4.2 Role of BMC Medical Co., Ltd in Global Continuous Positive Airway Pressure Market 11.4.3 Recent Developments 11.4.4 SWOT Analysis 11.5 Drägerwerk AG & Co. KGaA 11.5.1 Company Overview 11.5.2 Role of Drägerwerk AG & Co. KGaA in Global Continuous Positive Airway Pressure Market 11.5.3 Financials 11.5.4 SWOT Analysis 11.6 Fisher & Paykel Healthcare Limited 11.6.1 Company Overview 11.6.2 Role of Fisher & Paykel Healthcare Limited in Global Continuous Positive Airway Pressure Market 11.6.3 Financials 11.6.4 Recent Developments 11.6.5 SWOT Analysis 11.7 General Electric Company 11.7.1 Company Overview 11.7.2 Role of General Electric Company in Global Continuous Positive Airway Pressure Market 11.7.3 Financials 11.7.4 SWOT Analysis 11.8 Getinge AB 11.8.1 Company Overview 11.8.2 Role of Getinge AB in Global Continuous Positive Airway Pressure Market 11.8.3 Financials 11.8.4 SWOT Analysis 11.9 Koninklijke Philips N.V. 11.9.1 Company Overview 11.9.2 Role of Koninklijke Philips N.V. in Global Continuous Positive Airway Pressure Market 11.9.3 Financials 11.9.4 Recent Developments 11.9.5 SWOT Analysis 11.1 Löwenstein Medical GmbH & Co. KG 11.10.1 Company Overview 11.10.2 Role of Löwenstein Medical GmbH & Co. KG in Global Continuous Positive Airway Pressure Market 11.10.3 SWOT Analysis 11.11 Medical Depot, Inc. dba drives DeVilbiss Healthcare LLC 11.11.1 Company Overview 11.11.2 Role of Medical Depot, Inc. in Global Continuous Positive Airway Pressure Market 11.11.3 SWOT Analysis 11.12 Medtronic Plc 11.12.1 Company Overview 11.12.2 Role of Medtronic Plc in Global Continuous Positive Airway Pressure Market 11.12.3 Financials 11.12.4 SWOT Analysis 11.13 ResMed Inc. 11.13.1 Company Overview 11.13.2 Role of ResMed Inc. in Global Continuous Positive Airway Pressure Market 11.13.3 Financials 11.13.4 Recent Developments 11.13.5 SWOT Analysis 11.14 Smiths Group plc (Smiths Medical) 11.14.1 Company Overview 11.14.2 Role of Smiths Group plc in Global Continuous Positive Airway Pressure Market 11.14.3 Financials 11.14.4 SWOT Analysis 11.15 VYAIRE MEDICAL, INC. 11.15.1 Company Overview 11.15.2 Role of VYAIRE MEDICAL, INC. in Global Continuous Positive Airway Pressure Market 11.15.3 SWOT Analysis List of Tables Table 6.1: Association/Consortium of the Global Continuous Positive Airway Pressure Market Table 6.2: European Commission Medical Device Directives Table 6.3: Federal Agencies of EU Member States Table 6.4: Regulatory Bodies in Asia-Pacific Table 6.5: Global Continuous Positive Airway Pressure Market: Patent Analysis (by Country), January 2017-December 2020 List of Figures Figure 1: Global CPAP Market (by End-User), $Million, 2015-2026 Figure 2: Global CPAP Market (by Region), $Million, 2015-2026 Figure 3: Key Players CPAP Revenue (Cumulative), 2015-2019 Figure 4: Global CPAP Market: Impact Analysis Figure 5: Global CPAP Market Size COVID-19 Impact, 2020-2026 Figure 6: Global CPAP Market: Key Developments and Strategies, January 2016-February 2021 Figure 2.1: Global CPAP Market Segmentation Figure 3.1: Global CPAP Market: Research Methodology Figure 3.2: Primary Research Figure 3.3: Secondary Research Figure 3.4: Global CPAP Market: Bottom-Up Process 1 Figure 3.5: Global CPAP Market: Bottom-Up Process 2 Figure 3.6: Data Triangulation Figure 3.7: Total Number of Healthcare Company Profiles Figure 3.8: Forecast, Assumptions and Limitations Figure 4.1: Global CPAP Market Size COVID-19 Impact, 2015-2026 Figure 4.2: Global CPAP Market: COVID-19 Impact on Volume (by Key Regions) Figure 4.3: Potential COVID-19 Recovery Scenarios Figure 5.1 Global Prevalence and Incidence (Obstructive Sleep Apnea), 2015-2026 Figure 5.2: North America Prevalence and Incidence (Obstructive Sleep Apnea), 2015-2026 Figure 5.3: EU5 Prevalence and Incidence (Obstructive Sleep Apnea), 2015-2026 Figure 5.4: Asia-Pacific Prevalence and Incidence (Obstructive Sleep Apnea), 2015-2026 Figure 5.5: Obstructive Sleep Apnea Prevalence (by Region), 2015-2026 Figure 5.6: Obstructive Sleep Apnea Incidence (by Region), 2015-2026 Figure 5.7: Obstructive Sleep Apnea CPAP Devices Demand, Million Units, 2015-2026 Figure 5.8: Global Prevalence and Incidence (Chronic Obstructive Respiratory Diseases), 2015-2026 Figure 5.9: North America Prevalence and Incidence (Chronic Obstructive Respiratory Diseases), 2015-2026 Figure 5.10: EU5 Prevalence and Incidence (Chronic Obstructive Respiratory Diseases), 2015-2026 Figure 5.11: Asia-Pacific Prevalence and Incidence (Chronic Obstructive Respiratory Diseases), 2015-2026 Figure 5.12: Chronic Obstructive Respiratory Diseases Prevalence (by Region), 2015-2026 Figure 5.13: Chronic Obstructive Respiratory Diseases Incidence (by Region), 2015-2026 Figure 5.14: Obstructive Sleep Apnea CPAP Devices Demand, Million Units, 2015-2026 Figure 5.15: Global Prevalence and Incidence (Neuromuscular Disorders), 2015-2026 Figure 5.16: North America Prevalence and Incidence (Neuromuscular Disorders), 2015-2026 Figure 5.17: EU5 Prevalence and Incidence (Neuromuscular Disorders), 2015-2026 Figure 5.18: Asia-Pacific Prevalence and Incidence (Neuromuscular Disorders), 2015-2026 Figure 5.19: Neuromuscular Disorders Prevalence (by Region), 2015-2026 Figure 5.20: Neuromuscular Disorders Incidence (by Region), 2015-2026 Figure 5.21: Neuromuscular Disorders CPAP Devices Demand, Units, 2015-2026 Figure 5.22: Global Prevalence and Incidence (COVID-19), January 22, 2020-January 01, 2021 Figure 5.23: North America Prevalence and Incidence (COVID-19), January 22, 2020-January 01, 2021 Figure 5.24: EU5 Prevalence and Incidence (COVID-19), January 22, 2020-January 01, 2021 Figure 5.25: Asia-Pacific Prevalence and Incidence (COVID-19), January 22, 2020-January 01, 2021 Figure 5.26: COVID-19 CPAP Devices Demand, Units, 2020-2026 Figure 5.27: Asthma Incidence Y-o-Y Analysis (by Region), 1991-2026 Figure 5.28: Asthma Incidence (by Region), 2015-2026 Figure 5.29: Asthma Prevalence Y-o-Y Analysis (by Region), 1991-2026 Figure 5.30: Asthma Prevalence (by Region), 2015-2026 Figure 5.31: Pneumoconiosis Incidence Y-o-Y Analysis (by Region), 1991-2026 Figure 5.32: Pneumoconiosis Incidence (by Region), 2015-2026 Figure 5.33: Pneumoconiosis Prevalence Y-o-Y Analysis (by Region), 1991-2026 Figure 5.34: Pneumoconiosis Prevalence (by Region), 2015-2026 Figure 5.35: Upper Respiratory Tract Infections Incidence Y-o-Y Analysis (by Region), 1991-2026 Figure 5.36: Upper Respiratory Tract Infections Incidence (by Region), 2015-2026 Figure 5.37: Upper Respiratory Tract Infections Prevalence Y-o-Y Analysis (by Region), 1991-2026 Figure 5.38: Upper Respiratory Tract Infections Prevalence (by Region), 2015-2026 Figure 5.39: Lower Respiratory Tract Infections Incidence Y-o-Y Analysis (by Region), 1991-2026 Figure 5.40: Lower Respiratory Tract Infections Incidence (by Region), 2015-2026 Figure 5.41: Lower Respiratory Tract Infections Prevalence Y-o-Y Analysis (by Region), 1991-2026 Figure 5.42: Lower Respiratory Tract Infections Prevalence (by Region), 2015-2026 Figure 5.43: Other Conditions CPAP Devices Demand, Units, 2015-2026 Figure 6.1: Global Continuous Positive Airway Pressure Market Supply Chain Analysis Figure 6.2: Global CPAP Market: Regulatory Landscape Figure 6.3: EU Regulatory Pathway for Medical Device Figure 6.4: NMPA Regulatory Pathway for Medical Device Figure 6.5: PMDA Regulatory Pathway for Medical Device Figure 6.6: Global Continuous Positive Airway Pressure Market: Patent Analysis (by Quarters), January 2015-December 2020 Figure 7.1 Global Market Company Share Analysis (CPAP Mode Ventilator and CPAP), 2019 Figure 7.2: Regional Company Market Share (CPAP Mode Ventilators), 2019 Figure 7.3: Regional Company Market Share (CPAP), 2019 Figure 7.4 Global CPAP Market Growth Share Matrix (2015-2019) Figure 7.5: Share of Key Developments and Strategies, January 2016-February 2021 Figure 7.6: New Offerings (by Company), January 2016-Febraury 2021 Figure 7.7: Partnerships and Alliances (by Company), January 2016-Febraury 2021 Figure 7.8: Partnerships and Alliances (by Company), January 2016-Febraury 2021 Figure 8.1: Global CPAP Market Opportunity Assessment, 2015-2026 Figure 8.2: Global CPAP Market Size and Growth Potential, $Billion, 2015-2026 Figure 8.3: Global Prevalence (Obstructive Sleep Apnea), 2015-2026 Figure 8.4: Global Sleep Apnea Prevalence (by Age Group), 2015-and 2019 Figure 8.5: Impact Analysis of Drivers of the Continuous Positive Airway Pressure (CPAP) Market Figure 9.1: Global CPAP Market Size (Hospitals and Clinics), $Million, 2015-2026 Figure 9.2: Global CPAP Market Size (Nursing Homes), $Million, 2015-2026 Figure 9.3: Global CPAP Market Size (Elderly Care Homes), $Million, 2015-2026 Figure 9.4: Global CPAP Market Size (Home-Use), $Million, 2015-2026 Figure 10.1: Global Positive Airway Pressure Market (by Region), 2020 Figure 10.2: North America CPAP Market Size, $Million, 2015-2026 Figure 10.3: North America CPAP Market Shipments, Million Units, 2015-2026 Figure 10.4: North America CPAP Pricing Analysis, $, 2015-2026 Figure 10.5: North America Disease Prevalence, Million Cases, 2015-2026 Figure 10.6: North America CPAP Brand Share Analysis, 2019 Figure 10.7: North America CPAP Market: Key Competitors Figure 10.8: North America CPAP Market: Company Unit Shipment and Brand Matrix, 2015-2019 Figure 10.9: U.S. CPAP Market Size, $Million, 2015-2026 Figure 10.10: U.S. Disease Prevalence, Million Cases, 2015-2026 Figure 10.11: Canada CPAP Market Size, $Million, 2015-2026 Figure 10.12 Canada Disease Prevalence, Million Cases, 2015-2026 Figure 10.13: EU5 CPAP Market Size, $Million, 2015-2026 Figure 10.14: EU5 CPAP Market Shipments, Million Units, 2015-2026 Figure 10.15: EU5 CPAP Pricing Analysis, $, 2015-2026 Figure 10.16: EU5 Disease Prevalence, Million Cases, 2015-2026 Figure 10.17: EU5 CPAP Brand Share Analysis, 2019 Figure 10.18: EU5 CPAP Market: Key Competitors Figure 10.19: EU5 CPAP Market: Company Unit Shipment and Brand Matrix, 2015-2019 Figure 10.20: Germany CPAP Market Size, $Million, 2015-2026 Figure 10.21: Germany Disease Prevalence, Million Cases, 2015-2026 Figure 10.22: U.K. CPAP Market Size, $Million, 2015-2026 Figure 10.23: U.K. Disease Prevalence, Million Cases, 2015-2026 Figure 10.24: France CPAP Market Size, $Million, 2015-2026 Figure 10.25: France Disease Prevalence, Million Cases, 2015-2026 Figure 10.26: Italy CPAP Market Size, $Million, 2015-2026 Figure 10.27: Italy Disease Prevalence, Million Cases, 2015-2026 Figure 10.28: Spain CPAP Market Size, $Million, 2015-2026 Figure 10.29: Spain Disease Prevalence, Million Cases, 2015-2026 Figure 10.30: Asia-Pacific CPAP Market Size, $Million, 2015-2026 Figure 10.31: Asia-Pacific CPAP Market Shipments, Million Units, 2015-2026 Figure 10.32: Asia-Pacific CPAP Pricing Analysis, $, 2015-2026 Figure 10.33: Asia-Pacific Disease Prevalence, Million Cases, 2015-2026 Figure 10.34: Asia-Pacific CPAP Brand Share Analysis, 2019 Figure 10.35: Asia-Pacific CPAP Market: Key Competitors Figure 10.36: Asia-Pacific CPAP Market: Company Unit Shipment and Brand Matrix, 2015-2019 Figure 10.37: China CPAP Market Size, $Million, 2015-2026 Figure 10.38: China Disease Prevalence, Million Cases, 2015-2026 Figure 10.39: India CPAP Market Size, $Million, 2015-2026 Figure 10.40: India Disease Prevalence, Million Cases, 2015-2026 Figure 10.41: Japan CPAP Market Size, $Million, 2015-2026 Figure 10.42: Japan Disease Prevalence, Million Cases, 2015-2026 Figure 10.43: South Korea CPAP Market Size, $Million, 2015-2026 Figure 10.44: South Korea Disease Prevalence, Million Cases, 2015-2026 Figure 10.45: Rest of Asia-Pacific CPAP Market Size, $Million, 2015-2026 Figure 10.46: Bangladesh Disease Prevalence, Million Cases, 2015-2026 Figure 10.47: Pakistan Disease Prevalence, Million Cases, 2015-2026 Figure 10.48: Malaysia Disease Prevalence, Million Cases, 2015-2026 Figure 10.49: Indonesia Disease Prevalence, Million Cases, 2015-2026 Figure 10.50: Rest-of-the-World CPAP Market Size, $Million, 2015-2026 Figure 10.51: Rest-of-the-World CPAP Market Shipments, Million Units, 2015-2026 Figure 10.52: Europe except EU5 CPAP Market Size, $Million, 2015-2026 Figure 10.53: MEA CPAP Market Size, $Million, 2015-2026 Figure 10.54: Latin America Market Size, $Million, 2015-2026 Figure 11.1: APEX MEDICAL CORP.: Overall Product Portfolio Figure 11.2: APEX MEDICAL CORP.: SWOT Analysis Figure 11.3: Airon Corporation: Overall Product Portfolio Figure 11.4: Airon Corporation.: SWOT Analysis Figure 11.5: Asahi Kasei Corporation: Overall Product Portfolio Figure 11.6: Asahi Kasei Corporation: Overall Revenue, 2017-2019 Figure 11.7: Asahi Kasei Corporation: Revenue (by Segment), 2017-2019 Figure 11.8: Asahi Kasei Corporation: Revenue (by Region), 2017 Figure 11.9: Asahi Kasei Corporation: Revenue (by Region), 2018-2019 Figure 11.10: Asahi Kasei Corporation: SWOT Analysis Figure 11.11: BMC Medical Co., Ltd: Overall Product Portfolio Figure 11.12: BMC Medical Co., Ltd: SWOT Figure 11.13: Drägerwerk AG & Co. KGaA: Overall Product Portfolio Figure 11.14: Drägerwerk AG & Co. KGaA: Overall Financials, 2017-2019 Figure 11.15: Drägerwerk AG & Co. KGaA: Revenue (by Region), 2017-2019 Figure 11.16: Drägerwerk AG & Co. KGaA: SWOT Analysis Figure 11.17: Fisher & Paykel Healthcare Limited: Overall Product Portfolio Figure 11.18: Fisher & Paykel Healthcare Limited: Overall Financials, 2018-2020 Figure 11.19: Fisher & Paykel Healthcare Limited.: Revenue (by Segment), 2018-2020 Figure 11.20: Fisher & Paykel Healthcare Limited: Revenue (by Region), 2018-2020 Figure 11.21: Fisher & Paykel Healthcare Limited: SWOT Analysis Figure 11.22: General Electric Company: Overall Product Portfolio Figure 11.23: General Electric Company: Overall Financials, 2018-2020 Figure 11.24: General Electric Company: Revenue (by Segment), 2018-2020 Figure 11.25: General Electric Company: Revenue (by Region), 2018-2020 Figure 11.26: General Electric Company: SWOT Analysis Figure 11.27: Getinge AB: Overall Product Portfolio Figure 11.28: Getinge AB: Overall Financials, 2018-2020 Figure 11.29: Getinge AB: Revenue (by Segment), 2018-2020 Figure 11.30: Getinge AB: Revenue (by Region), 2018-2019 Figure 11.31: Getinge AB: SWOT Analysis Figure 11.32: Koninklijke Philips N.V.: Overall Product Portfolio Figure 11.33: Koninklijke Philips N.V.: Overall Financials, 2017-2019 Figure 11.34: Koninklijke Philips N.V.: Revenue (by Business Segment), 2017-2019 Figure 11.35: Koninklijke Philips N.V.: Revenue (by Region), 2017-2019 Figure 11.36: Koninklijke Philips N.V.: SWOT Analysis Figure 11.37: Löwenstein Medical GmbH & Co. KG: Overall Product Portfolio Figure 11.38: Lowenstein Medical GmbH & Co. KG: SWOT Analysis Figure 11.39: Medical Depot, Inc.: Overall Product Portfolio Figure 11.40: Medical Depot, Inc.: SWOT Analysis Figure 11.41: Medtronic plc: Overall Product Portfolio Figure 11.42: Medtronic plc: Overall Financials, 2018-2020 Figure 11.43: Medtronic plc: Revenue (by Segment), 2018-2020 Figure 11.44: Medtronic plc: Revenue (by Region), 2018-2020 Figure 11.45: Medtronic plc: SWOT Analysis Figure 11.46: ResMed Inc.: Overall Product Portfolio Figure 11.47: ResMed Inc.: Overall Financials, 2018-2020 Figure 11.48: ResMed Inc.: Revenue (by Segment), 2018-2020 Figure 11.49: ResMed Inc.: Revenue (by Region), 2018-2020 Figure 11.50: ResMed Inc.: SWOT Analysis Figure 11.51: Smiths Group plc: Overall Product Portfolio Figure 11.52: Smiths Group plc: Overall Financials, 2018-2020 Figure 11.53: Smiths Group plc: Revenue (by Segment), 2018-2020 Figure 11.54: Smiths Group plc: Revenue (by Region), 2018-2020 Figure 11.55: Smiths Group plc: Revenue (by Region), 2018 Figure 11.56: Smiths Group plc: Revenue (by Region), 2019-2020 Figure 11.57: Smiths Group plc: SWOT Analysis Figure 11.58: VYAIRE MEDICAL, INC.: Overall Product Portfolio Figure 11.59: VYAIRE MEDICAL, INC.: SWOT Analysis

Reviews

There are no reviews yet.

Be the first to review “Global Continuous Positive Airway Pressure (CPAP) Market: Analysis and Forecast, 2020-2026”