Description
China’s Germanium Resources Export
Germanium, a critical semiconductor material used extensively in the production of transistors and various electronic devices, boasts diverse applications. These include fiber optic systems, infrared optics, catalysts for polymerization reactions, electronics, and solar power. Its innate semiconductor excellence positions it at the forefront of technologies such as semiconductors, fiber optic communications, infrared optics, solar cells, chemical catalysts, and biomedical applications.
In a significant development, on July 3, 2023, China’s Ministry of Commerce and the General Administration of Customs issued a proclamation. This proclamation, approved by the State Council of the People’s Republic of China, establishes export controls on gallium and germanium-related items, aiming to safeguard national security and interests. These controls will be enforced starting from August 1, 2023, with administrative penalties or potential criminal liability for unauthorized exports or violations of the authorization scope.
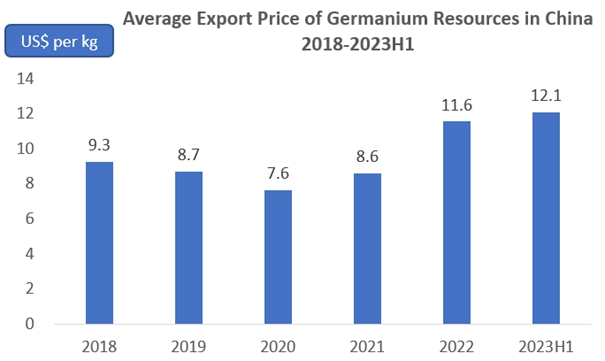
Examining the export trends from 2018 to 2022, China’s germanium resources exports displayed an overall upward trajectory. However, in 2022, export volumes dipped by 12.1% year-on-year, totaling around 19,315 tons, while the export value rose by 18%, reaching approximately 223 million U.S. dollars. During the same period, the average price of China’s germanium resources exports witnessed fluctuations but generally trended upwards, increasing from USD 9.3 per kilogram in the first half of 2018-2023 to USD 12.1 per kilogram.
China’s germanium resources found their way to approximately 30 countries and regions across the globe in 2022-2023. Leading destinations for these exports, in terms of value, include Japan, Germany, France, South Korea, and the United States. Japan emerged as the primary recipient, receiving around 30.9% of China’s total germanium resource exports in 2022, amounting to about 5,960 tons and a value of approximately US$51.4 million, making up 23.0% of the total export value for that year.
China’s prominence in the global germanium resources market is undeniable. Nevertheless, with the implementation of export restrictions effective from August 1, 2023, a notable decline in export volume and value is anticipated in 2023 compared to the previous year. This development raises questions about the future of China’s germanium resource exports, which will be explored in more detail in upcoming sections. These sections will delve into key drivers, challenges, opportunities, and competitive dynamics, as well as the impact of COVID-19 and constraints on the growth of this industry.
Topics covered:
- Export Status and Main Sources of Chinese Germanium Resources, 2018-2022
- Key Drivers and Market Opportunities for China’s Germanium Resources Exports
- What are the key drivers, challenges and opportunities for China’s germanium resources exports during the forecast period 2023-2032?
- Which are the key players in the Chinese germanium resources export market and what are their competitive benchmarks?
- What are the expected revenues from the Chinese germanium resources export market during the forecast period of 2023-2032?
- What strategies have been adopted by the key players in the market to increase their market share in the industry?
- Which segment of the Chinese germanium resources export market is expected to dominate the market by 2032?
- What are the competitive advantages of the key players in the Chinese germanium resources export market?
- What is the impact of COVID-19 on China’s germanium resource exports?
- What are the main constraints inhibiting the growth of China’s germanium resource exports?
Table of Contents
2018-2022 China Germanium Resources Export Analysis
1.1. China’s Germanium Resource Export Scale
1.1.1. China’s Germanium Resource Export Volume
1.1.2. China’s Germanium Resources Export Value
1.1.3. Chinese Germanium Resources Export Prices
1.2. China’s Main Export Destinations of Germanium Resources
1.2.1. By Export Volume
1.2.2. By Value of Exports
2018-2023 China Unwrought Germanium Export Analysis
2.1. Unwrought Germanium Exports
2.2. Exports of Unwrought Germanium
2.3. Export Prices of Unwrought Germanium
2.4. Export Destinations for Unwrought Germanium
2.4.1. By Volume of Exports
2.4.2. By Value of Exports
2018-2023 China Wrought and Rolled Germanium Export Analysis
3.1. Exports of Wrought Germanium
3.2. Export Value of Wrought Germanium
3.3. Export Prices for Wrought Germanium
3.4. Export Destinations of Wrought Germanium
3.4.1. By Volume of Exports
3.4.2. By Value of Exports
2018-2023 China Germanium Oxide Export Analysis
4.1. Exports of Germanium Oxides
4.2. Export Value of Germanium Oxides
4.3. Export Prices of Germanium Oxides
4.4. Export Destinations of Germanium Oxides
4.4.1. By Volume of Exports
4.4.2. By Value of Exports
Main Export Destinations of Germanium Resources in China, 2018-2023
5.1. Japan
5.2. United States of America
5.3. Germany
5.4. Korea
5.5. France
5.6. Other Export Destinations
Outlook for China’s Export of Germanium Resources, 2023-2032
6.1. Factors Affecting the Export of Chinese Germanium Resources
6.1.1. Favorable Factors
6.1.2. Unfavorable Factors
6.2. 2023-2032 China’s Germanium Resources Export Forecasts
6.2.1. Export Volume Forecasts
6.2.2. Forecast of Main Export Destinations
6.2.3. Forecast of Major Exported Germanium Resource Types
LIST OF CHARTS
Chart 2018-2022 China Germanium Resources Export Volume
Chart China Germanium Resources Export Value 2018-2022
Chart Average Price of Germanium Resources Exported from China, 2018-2022
Chart Major Export Destinations of Chinese Germanium Resources by Export Volume, 2018-2022
Chart Major Export Destinations of Chinese Germanium Resources by Export Value, 2018-2022
Chart 2018-2022 China Unwrought Germanium Exports
Chart China’s Unwrought Germanium Exports 2018-2022
Chart 2018-2022 China Unwrought Germanium Export Average Price
Chart Main Export Destinations of Chinese Unwrought Germanium by Export Volume, 2018-2022
Chart Main Export Destinations of Chinese Unwrought Germanium by Export Value, 2018-2022
Chart 2018-2022 China Wrought and Rolled Germanium Exports
Chart 2018-2022 China’s Wrought and Rolled Germanium Export Value
Chart 2018-2022 China Average Price of Wrought and Rolled Germanium Exports
Chart Major Export Destinations of Wrought and Rolled Germanium in China, by Export Volume, 2018-2022
Chart Major Export Destinations of Wrought and Rolled Germanium in China, by Export Value, 2018-2022
Chart 2018-2022 China’s Exported Germanium Resources to Japan
Chart 2018-2022 China’s Exported Germanium Resources to the United States
Chart 2018-2022 China’s Exported Germanium Resources to South Korea
Chart 2018-2022 China’s Exported Germanium Resources to France
Chart 2018-2022 China’s Exported Germanium Resources to Germany
Chart 2023-2032 China Germanium Resources Export Forecast


Reviews
There are no reviews yet.